Featured Project
I developed four interactive web applications for
ClimateUEA (University of
East Anglia).
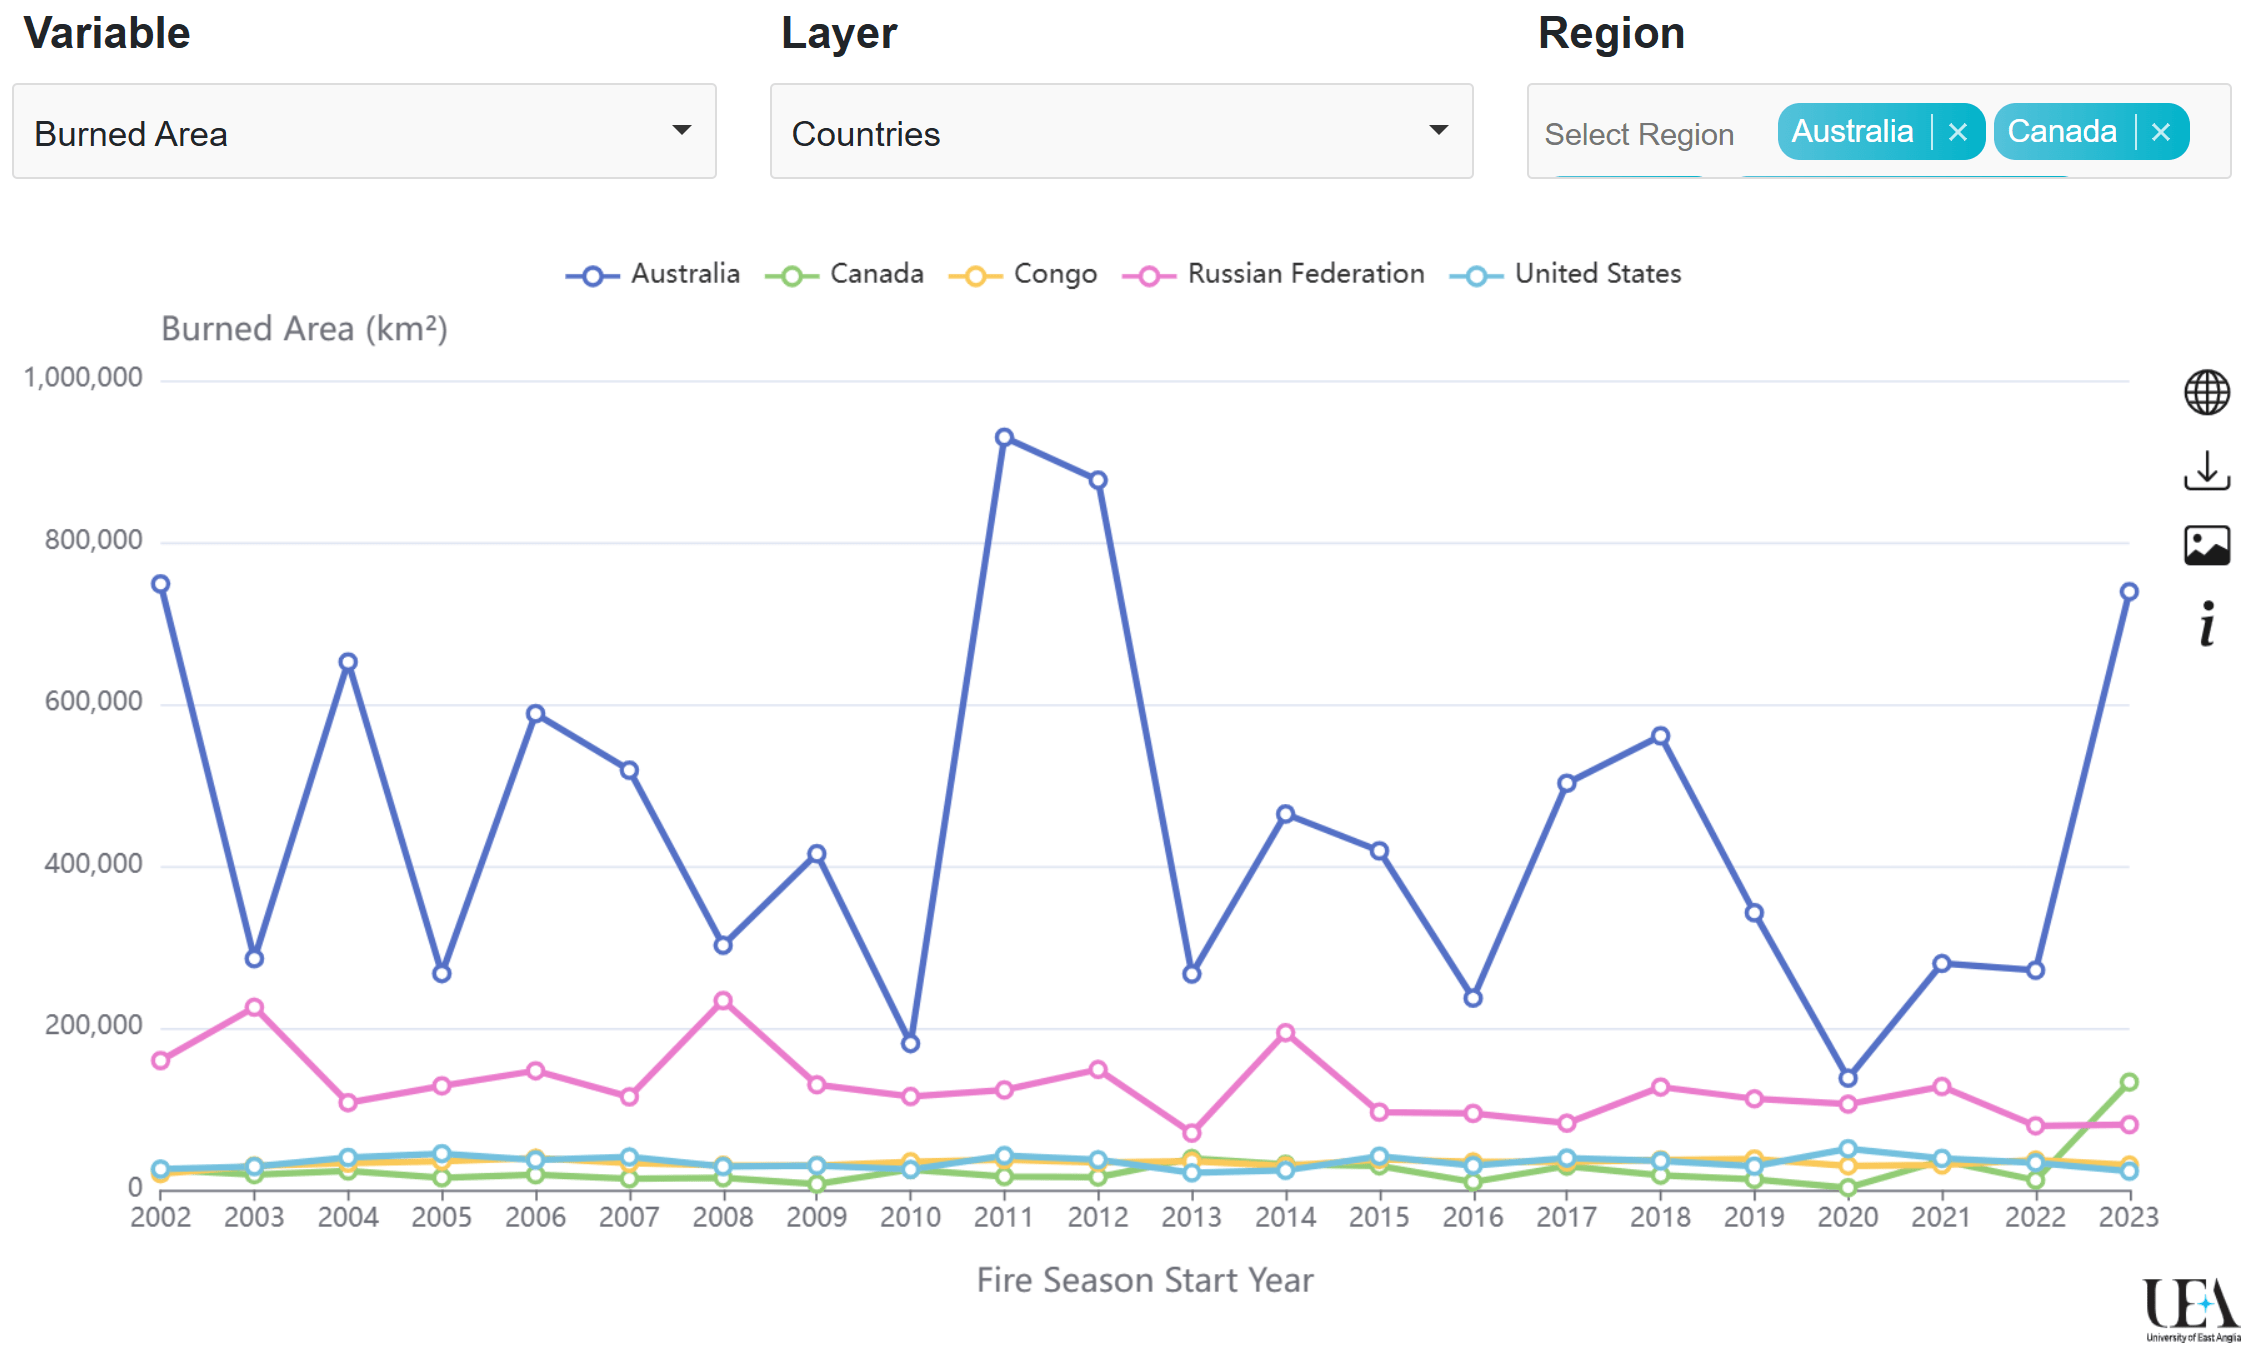
Two apps were designed to showcase their
State of Wildfires data published in
2024, which
will be updated annually. The other two apps were built to visualise
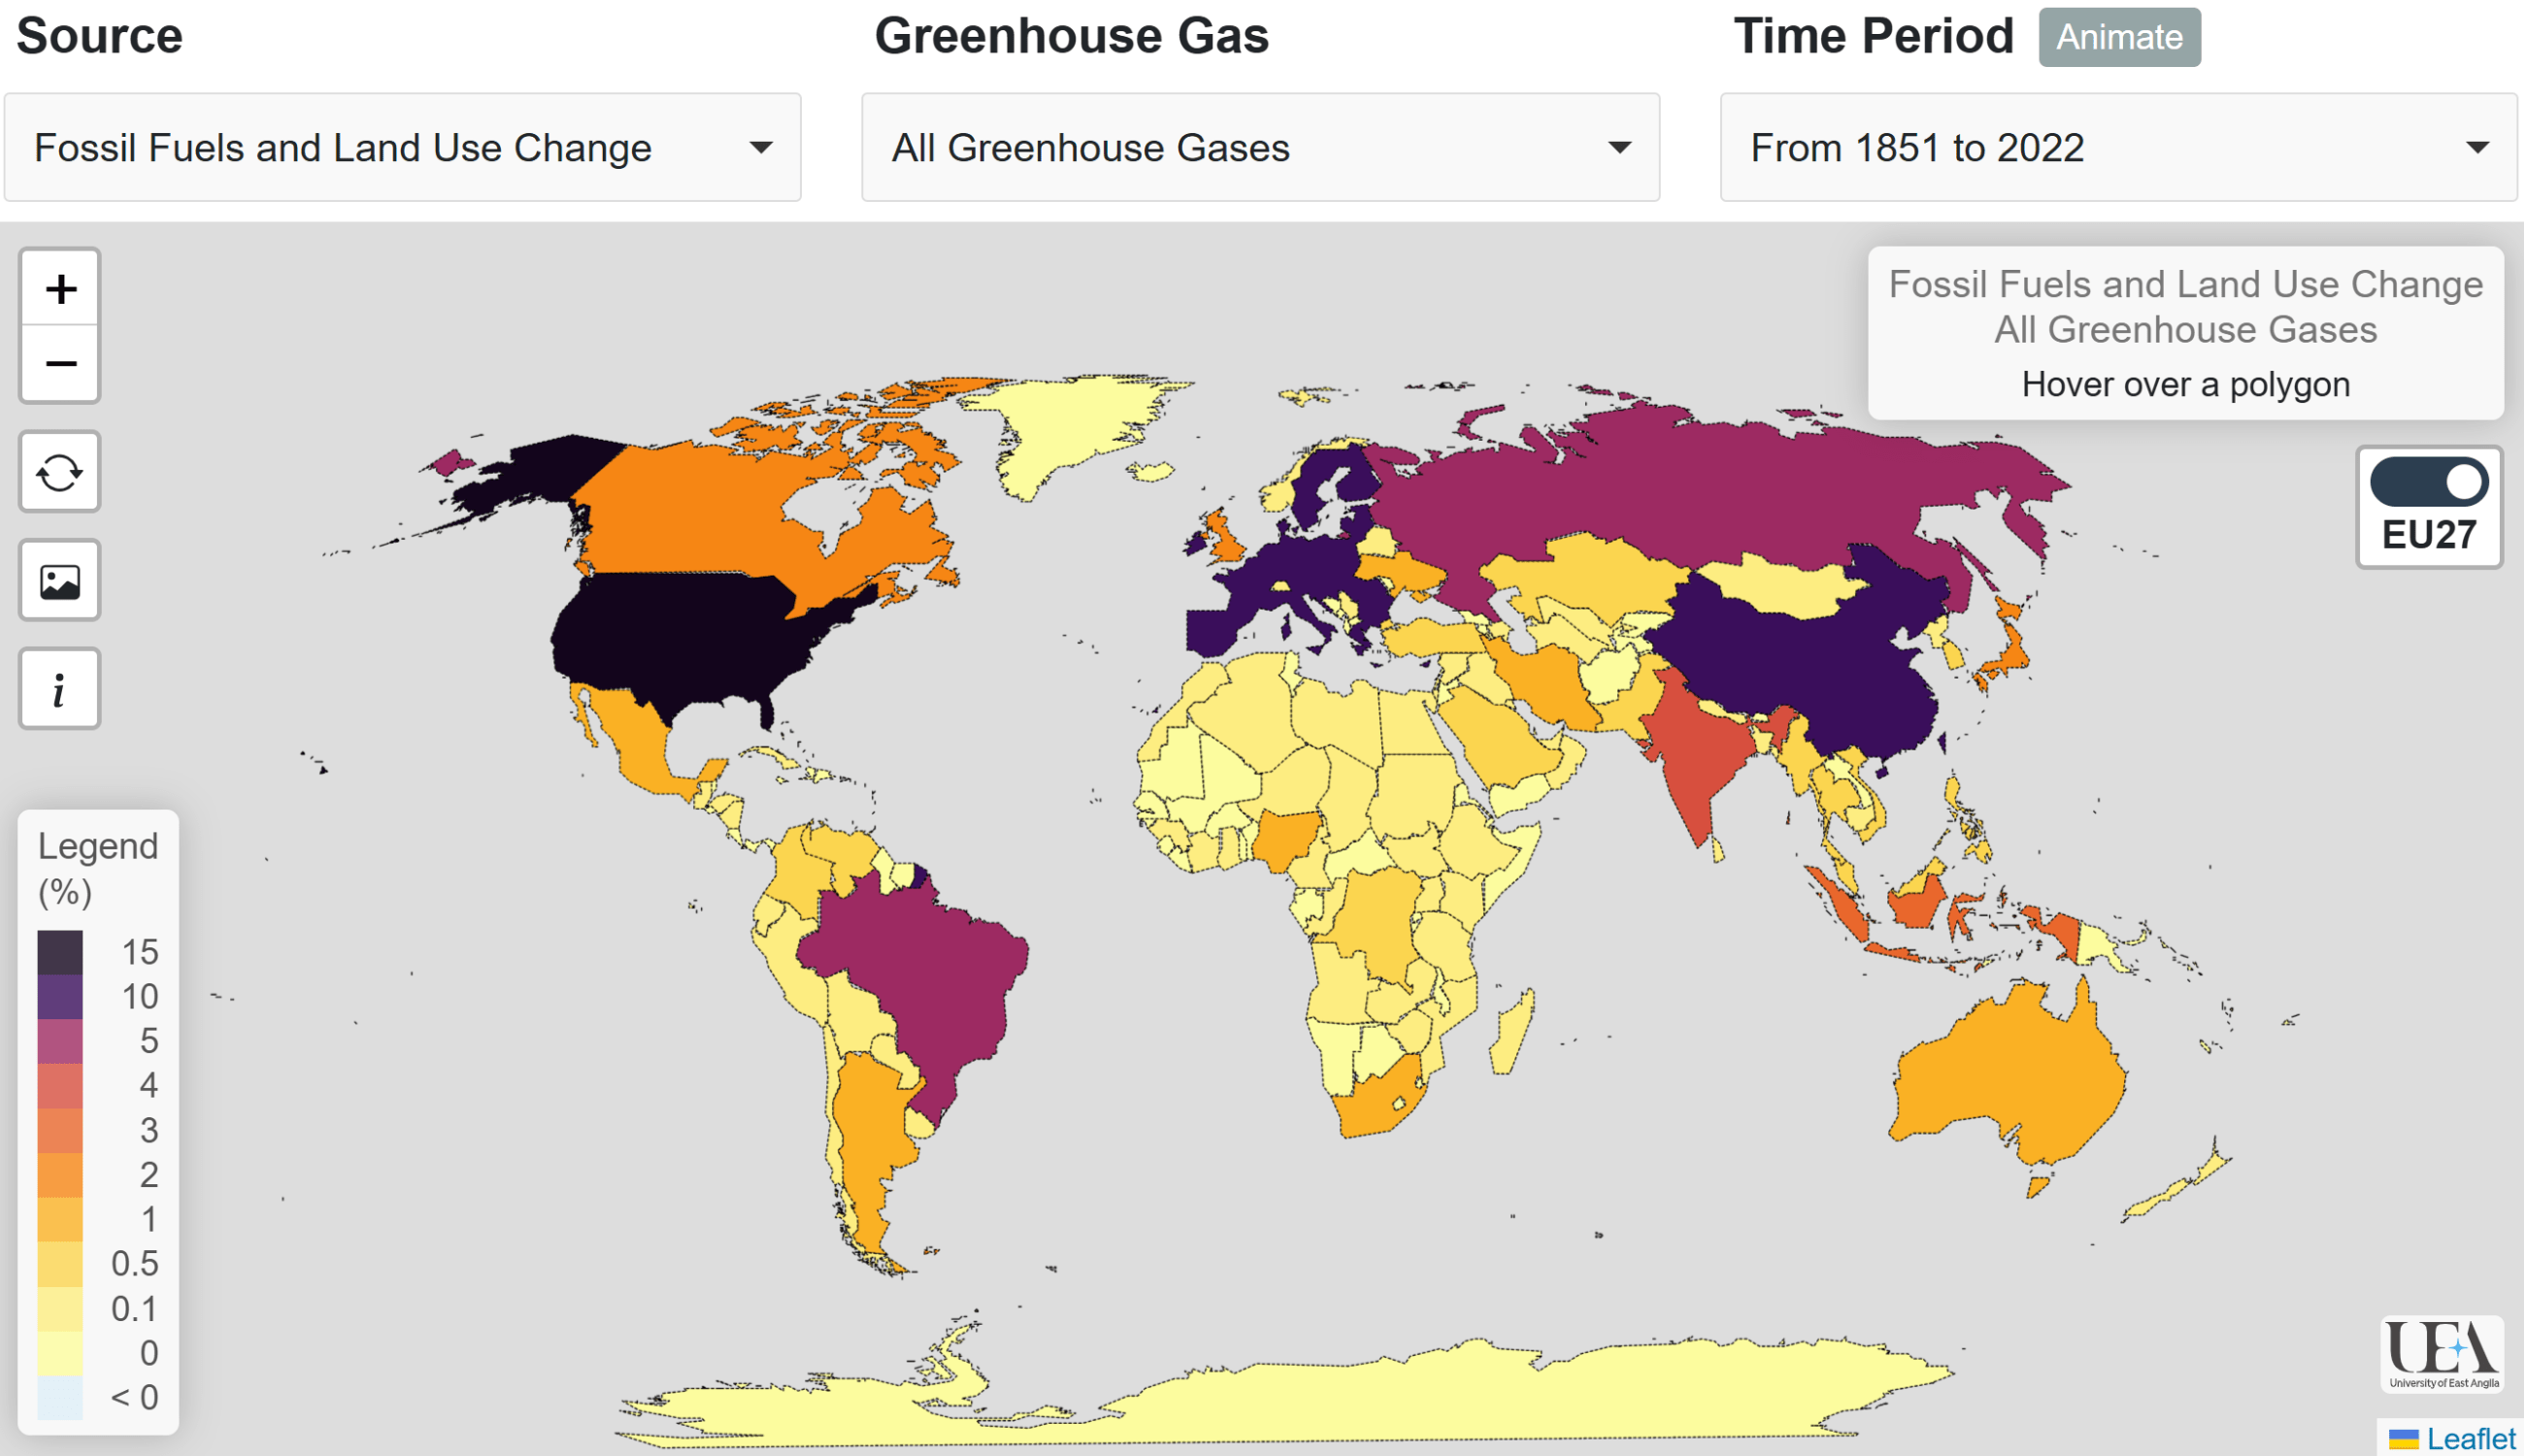
the National Contributions to Global Warming data
published in
2023 and
display the percentage change in global mean surface temperature
across different time periods for each country.
Open the tabs below to reveal more information about this project.
Links to the apps hosted on the ClimateUEA website can also be found
below.
Objectives
- Preprocess geospatial data and convert into JSON and GeoJSON format
- Build self-contained web applications using JavaScript that can be deployed on the ClimateUEA website
Data Processing
- Developed Bash and Python scripts to automate the processing and conversion of geospatial data in CSV format to JSON or GeoJSON files
- Calculated new statistics from the data, such as percentage change in temperature for each country across different time periods (e.g. 1851 to 2022)
Agile Development
- Collaborated closely with the team to create working solutions quickly
- Continuously refined app user-interface and features based on feedback
- Adapted to bespoke requests, such as adding information popups and options for users to download map images and data
Deployment
- Worked with UEA IT team to deploy each app on AWS Amplify
- Set up continuous integration and version control via Bitbucket to allow rapid updates to applications
- Apps in production were embedded into the ClimateUEA web pages using iFrames
State of Wildfires
National Contributions to Global Warming